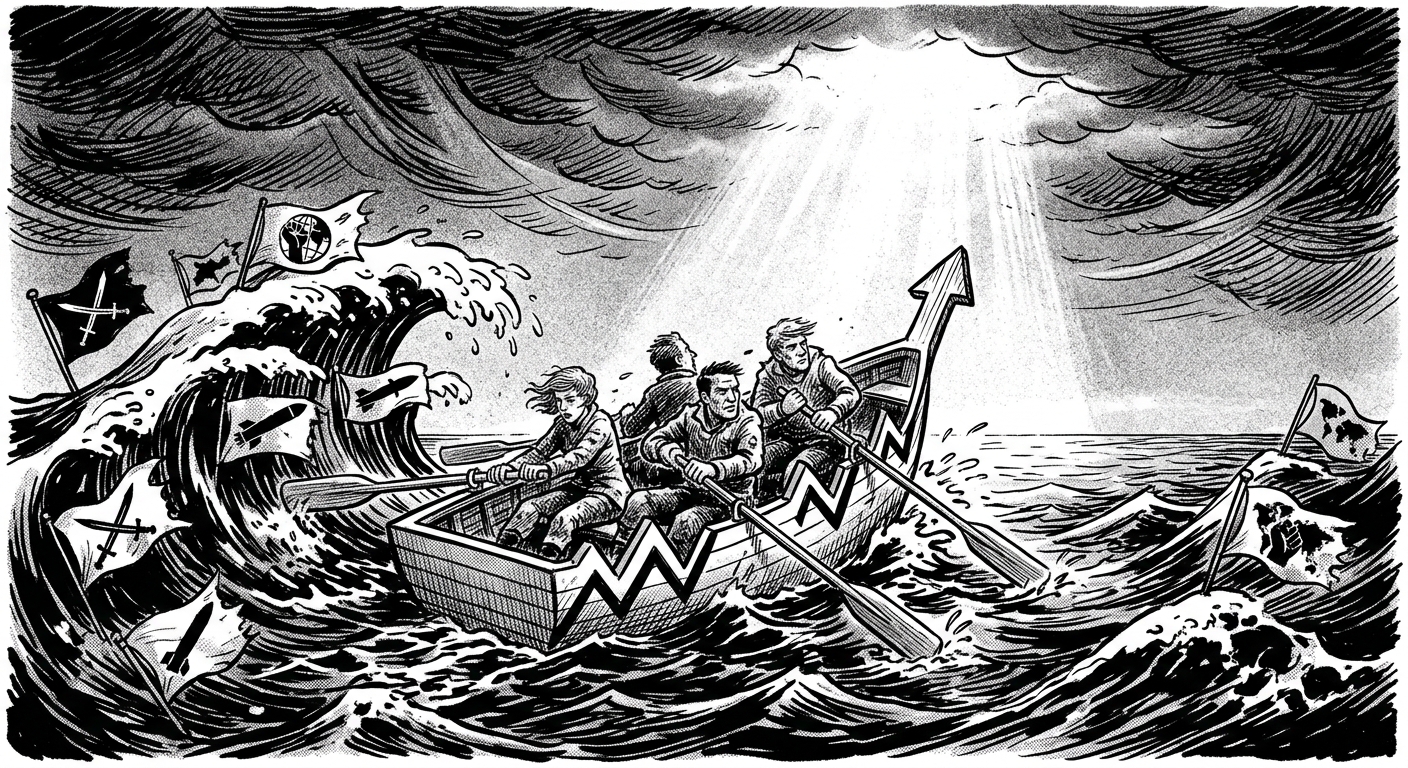
The S&P 500 has found itself in a precarious position, teetering on the edge of a key support zone that stretches from $6,581 to $6,489. In the world of trading, this range is akin to a lifeboat in stormy seas, providing a vital refuge for investors seeking stability amid swirling geopolitical turbulence. As traders cautiously navigate these waters, the technical indicators reveal a beacon of hope—could a relief rally be on the horizon?
The Significance of the 'Fake Break'
In recent trading sessions, the index experienced what technical analysts refer to as a 'fake break' below this crucial support level. This phenomenon, where prices momentarily dip below a support zone only to rebound, can be the market's way of testing the resolve of traders. It acts like a magician pulling a rabbit out of a hat, creating an illusion that can mislead even the savviest investors. However, the subsequent momentum shift has signaled that the bears might be losing their grip, setting the stage for a potential reversal.
The Bullish Flag Pattern
Adding fuel to the optimistic fire, the formation of a bullish flag pattern has emerged within the S&P 500's technical landscape. This pattern, characterized by a sharp price increase followed by a consolidation phase, often precedes a breakout to the upside. For traders, spotting this pattern is akin to finding a treasure map—each flagpole and consolidation phase marking a potential profit opportunity. As technical analysts scrutinize the charts, the bullish flag could be the signal that short-term investors have been waiting for.
Meeting Decline Targets
Interestingly, the market has met its previous decline targets, which can be seen as a critical milestone in its journey. With these goals achieved, the S&P 500 is positioned for possible short-term upside. It’s as though the market has taken a breath, preparing for a sprint after a long, arduous trek down the mountain. The question lingering in the minds of traders is whether this momentary pause will yield a burst of upward momentum.
Actionable Insights for Traders
As we navigate this intricate web of geopolitical headwinds and technical signals, vigilance is vital. Key support levels to watch remain firmly anchored between $6,581 and $6,489. Should the index hold above this zone, traders may want to position themselves for a potential rally, keeping their sights set on resistance levels that could serve as profit-taking points. Conversely, a decisive break below this support could spell further trouble, with traders needing to reassess their strategies.
In the end, the S&P 500's current technicals paint a picture of cautious optimism. While the geopolitical landscape may resemble a turbulent sea, the indicators suggest that there may be calmer waters ahead for traders willing to read the charts and act on the signals. So, are you ready to hoist your sails and navigate the potential rally?